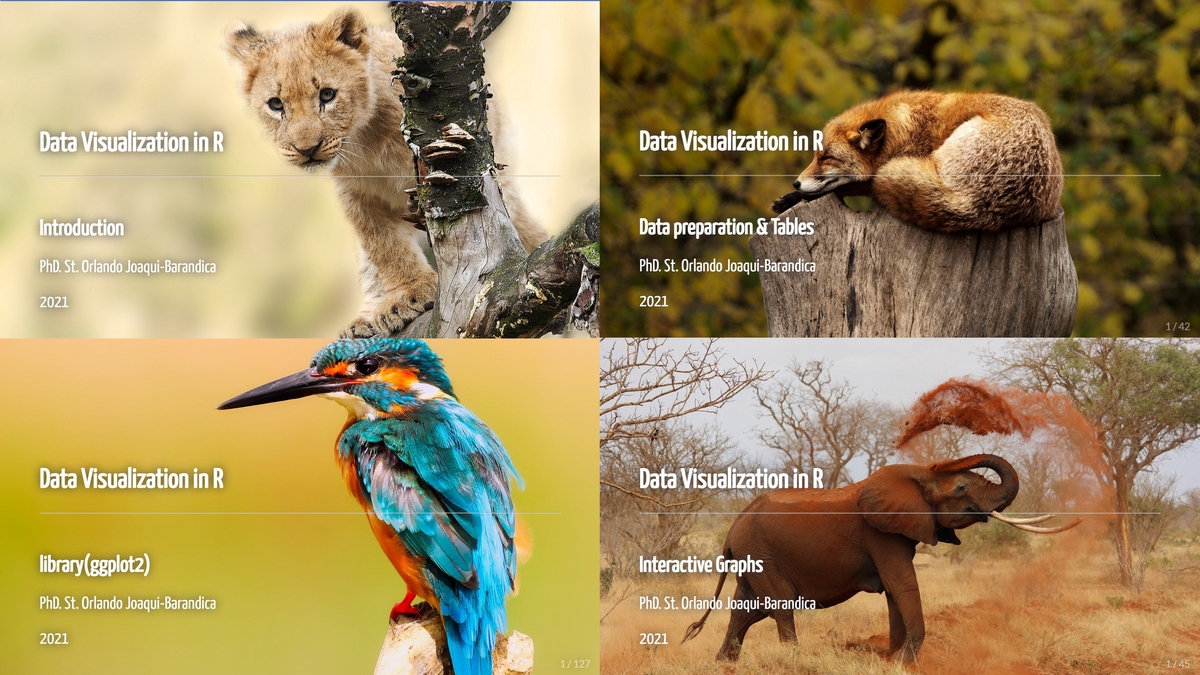
Data Visualization in R
Knowing how to do data science is also knowing how to communicate. Effective communication is the cornerstone of impactful data science. Either teaching data-related skills or reporting the latest results obtained in our statistical processes.
 DataViz in R
These slides will cover a mix of styles for #DataViz. We will learn the necessary structure of the data for the adequate visualization of the information. We will work with packages like ggplot2, plotly, highchart, among others.
I present the next structure:
- Introduction
- Data preparation
- Static #️⃣DataViz
- Interactive #️⃣DataViz
1. Introduction
- Visit slides: 🔗 Here! Introduction
- Recommendation to see in full screen (F11 - Google Chrome)
2. Structure and Manipulation of Data
- Visit slides: 🔗 Here! Data Preparation & Tables
- Recommendation to see in full screen (F11 - Google Chrome)
3. Static #️⃣DataViz
- Visit slides: 🔗 Here! DataViz ggplot2
- Recommendation to see in full screen (F11 - Google Chrome)
4. Interactive #️⃣DataViz
- Visit slides: 🔗 Here! Interactive graphs
- Recommendation to see in full screen (F11 - Google Chrome)
5. Rmarkdown #️⃣DataViz
- Visit slides: 🔗 Here! Rmarkdown
- Recommendation to see in full screen (F11 - Google Chrome)